
Welcome to the TRENDABLE Graph Gallery
Click any box to learn more.
Heart Stent Manufacturing
This example dataset is stable & capable.
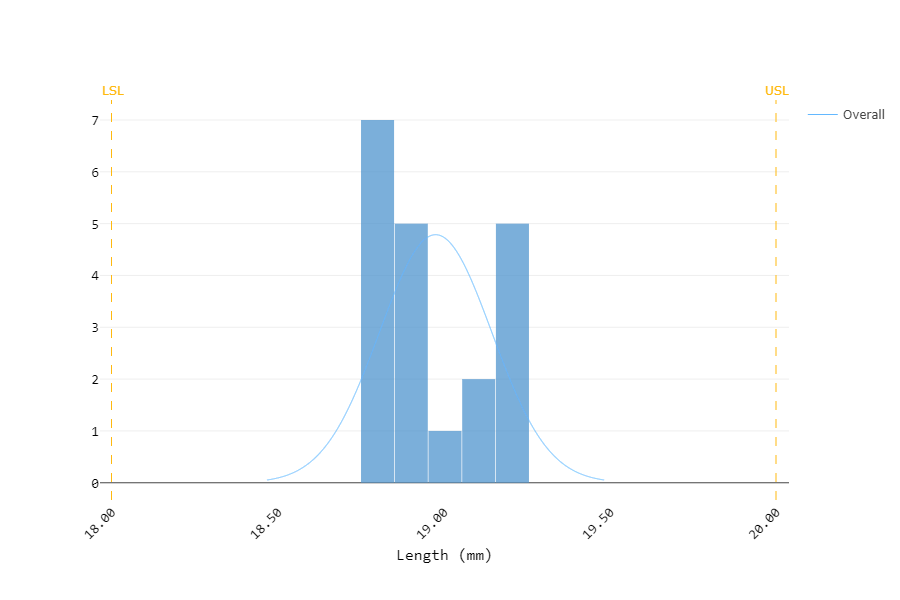
Heart Stent Length – Histogram
Transducer Frequency
This example is stable, but not capable.
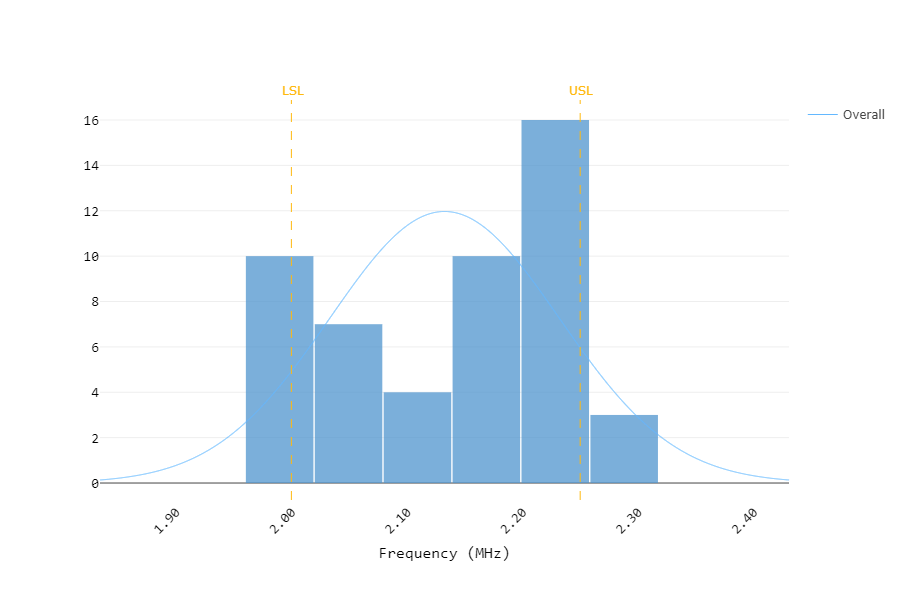
Transducer Frequency – Histogram
Cereal Box Filling Weight
This dataset is an example with a large subgroup size (50).
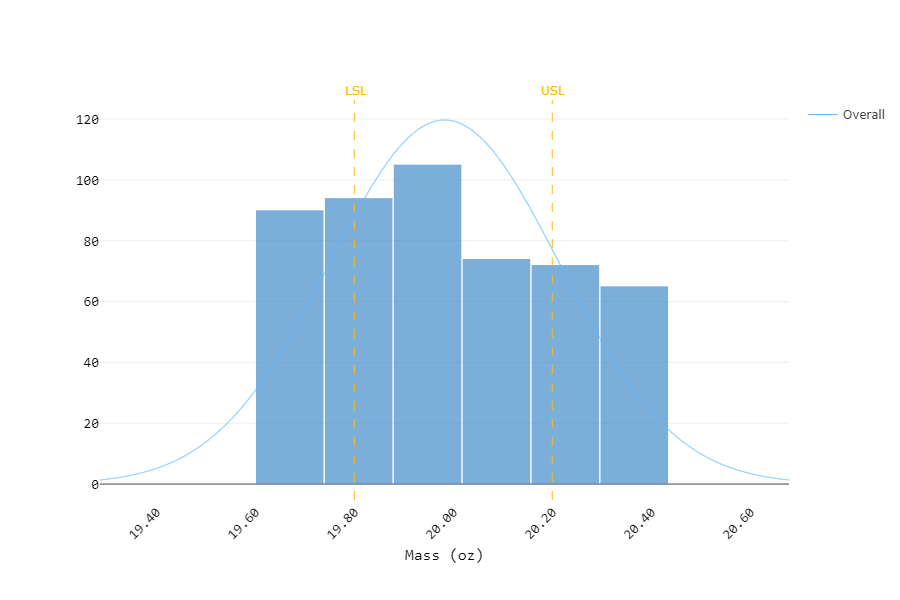
Cereal Box Mass – Histogram
Freezer Temperature
This is an example of a skewed distribution.
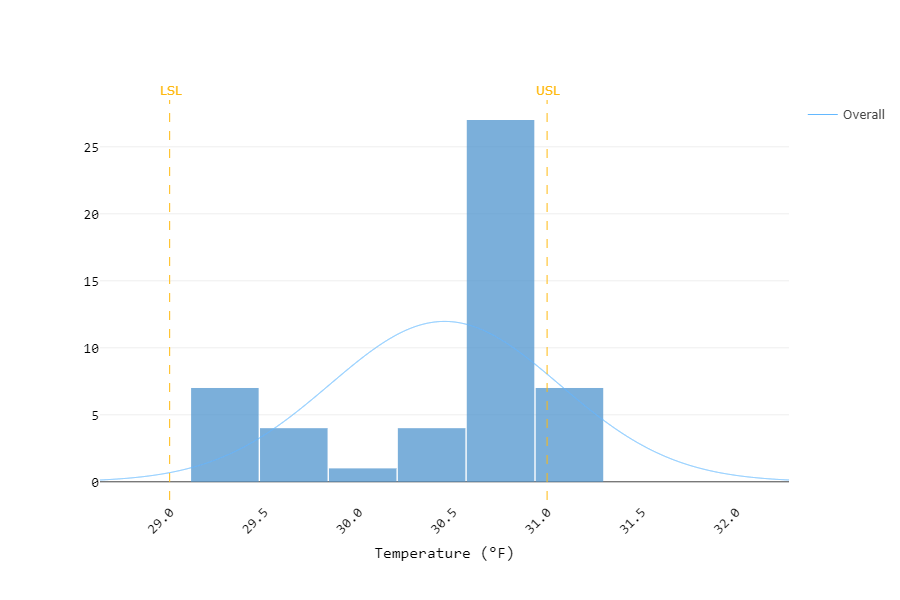
Meat Freezer Temp – Histogram
Battery Capacity
This dataset has a small sample size (10).
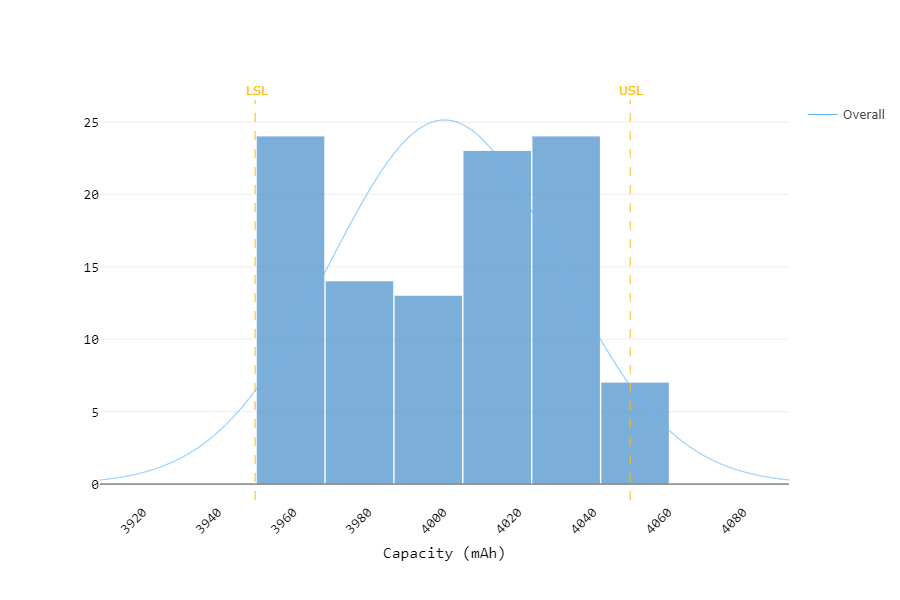
Battery Capacity – Histogram
Detergent pH
This is process is Stable but not Capable.
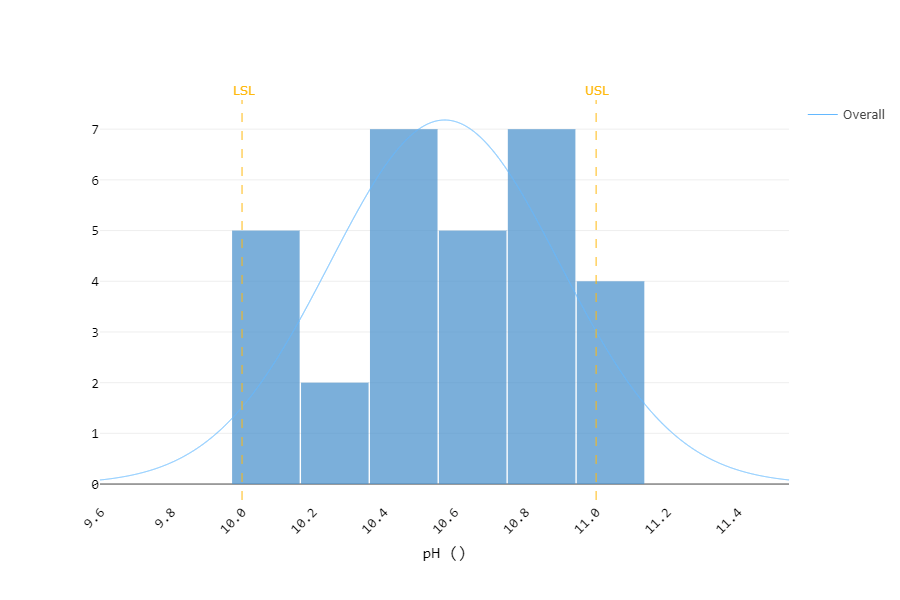
Detergent pH – Histogram
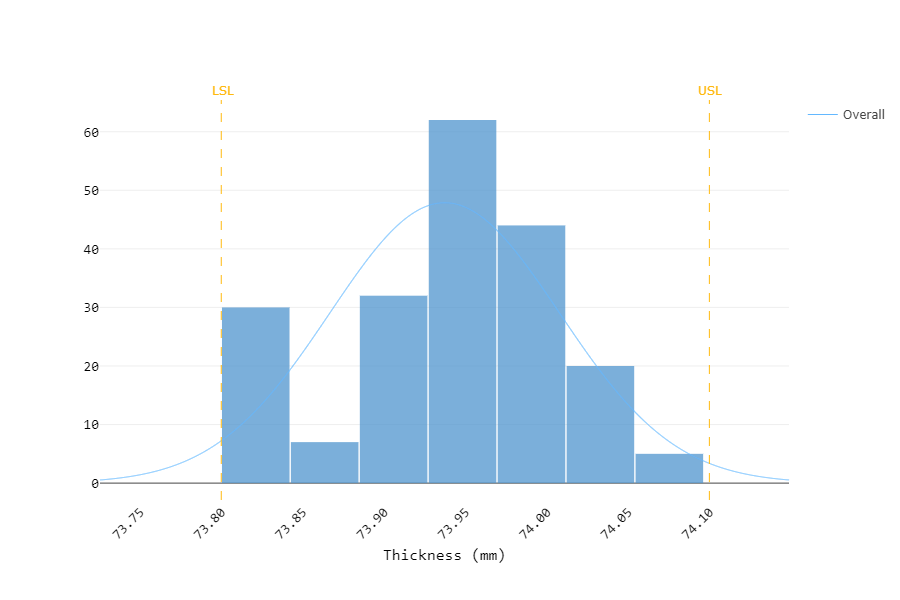
Mason Jar Lid Diameter
This dataset shows consecutive measurements that alternate up and down.
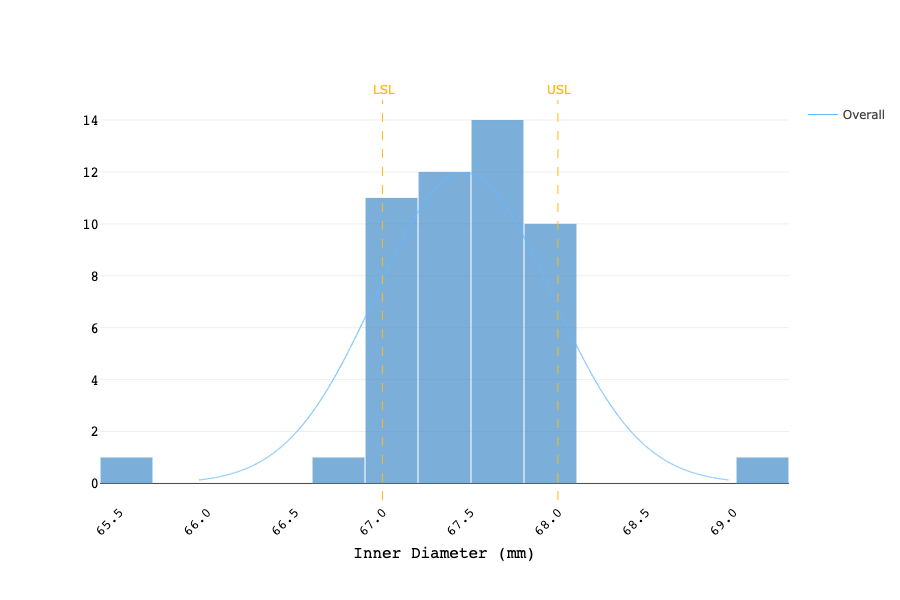
Mason Jar Lid Inner Diameter – Histogram
Pharmacy Wait Time
This is process is left skewed.
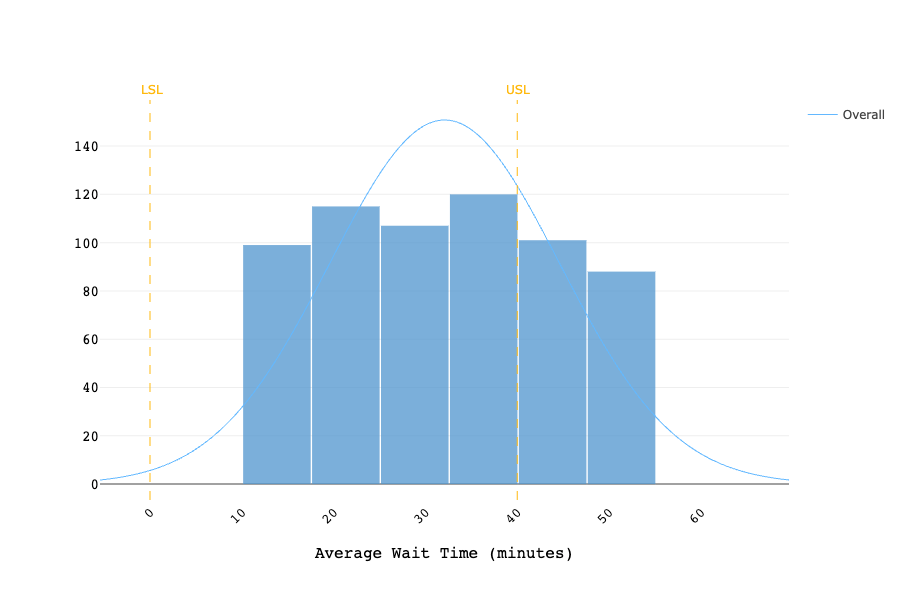
Pharmacy Wait Time – Histogram
Pipe Diameter
The subgroup size of this dataset is ten (10).
Pipe Diameter – Histogram
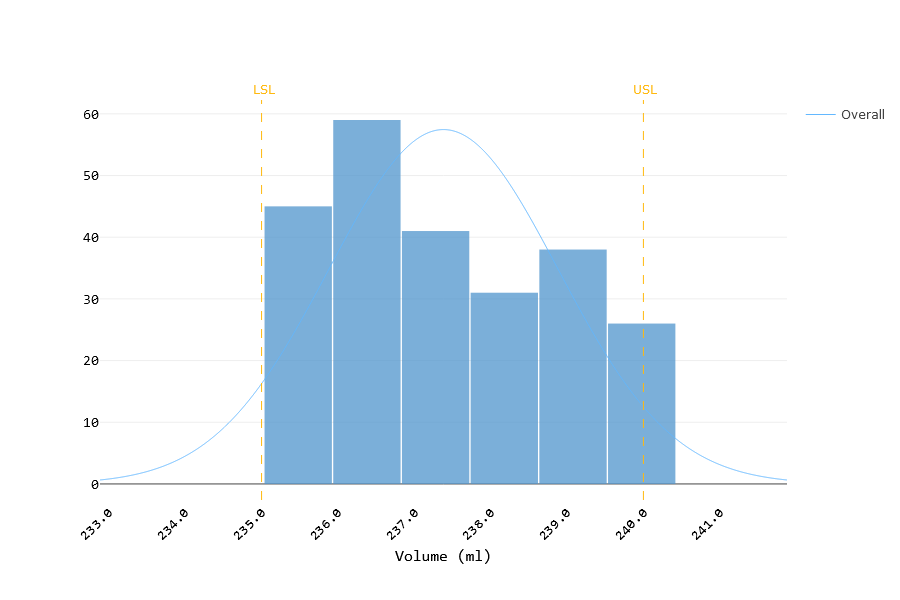
Coffee Volume
This is process shows multiple patterns in the data.
Coffee Volume – Histogram
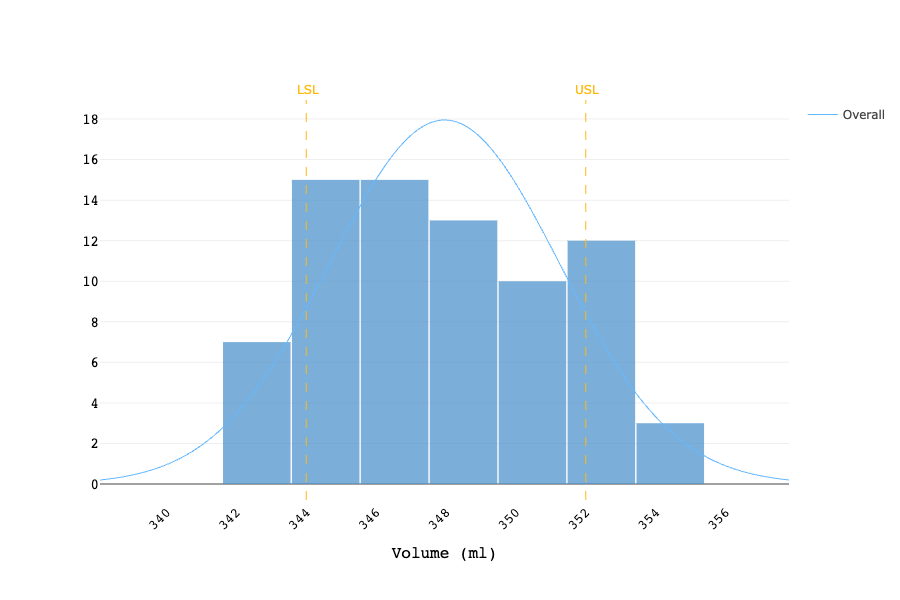
Orange Juice Fill Volume
This is dataset was collected in large subgroups (20).
Orange Juice Volume – Histogram
Elongation of Spandex
This dataset has low Cpk and low Ppk values.
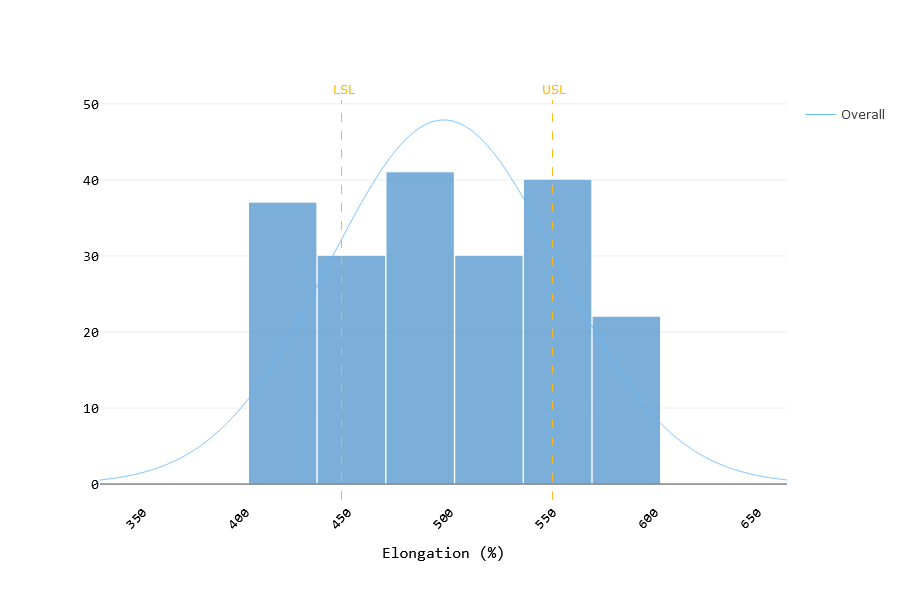
Elongation of Spandex – Histogram