Announcing TRENDABLE for Data Collection 2.0!
Gauge Tracking
It is important to keep track of gauge performance over time so you know when to re-calibrate before you go out of spec. TRENDABLE™ for Data Collection automatically associates information about the measurement device whenever your inspection team does a QC check. Accuracy and precision are key to your quality program’s success. Take the guess-work out of measurement system compliance today!
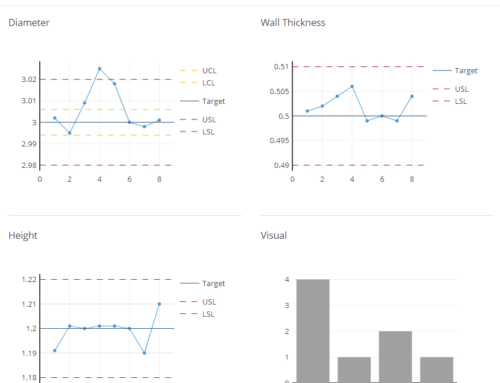
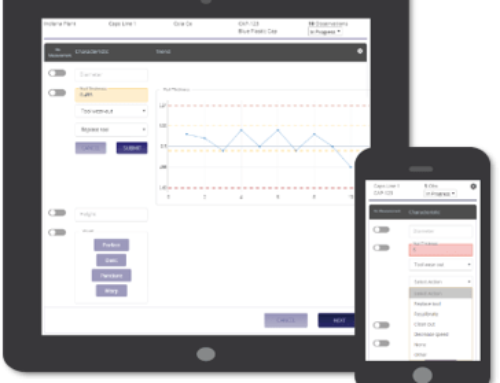
Run Charts & One-sided Limits
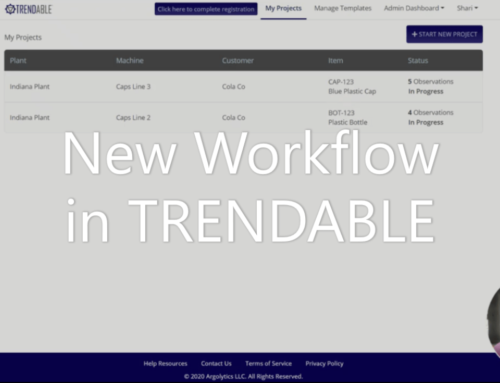
Sometimes a process only has an upper or lower threshold. Other times, “limits” doesn’t make sense. TRENDABLE™ for Data Collection v2.0 gives you more control over the graphics displayed to inspectors. Simple tools increase compliance. Start a new project and begin collecting measurements with minimal inputs. TRENDABLE™ for Data Collection takes care of standardization and storage. Now your team can focus on the efficiencies that really matter.
Stack Results
Your team is working hard to capture QC measurements and final inspection results. As a manager, you want to analyze that data for things like process stability and capability. TRENDABLE™ for Data Collection makes it easy to export the data that was collected by your inspection team. One click to export all data from multiple projects into a single, stacked spreadsheet. No need to copy paste or otherwise wrangle Excel files. The spreadsheet is laid out in a database-like format with all the measurements aligned in columns. It is ready for further analysis with TRENDABLE for Data Analysis. Stop wasting time manipulating data in Excel!
Even More Affordable
TRENDABLE™ for Data Collection now costs just $25 for 25,000 observations each month. Unlimited users, unlimited reports. Free setup. And the first 2000 observations every month are still free. See how affordable data collection can be with the Pricing Calculator.