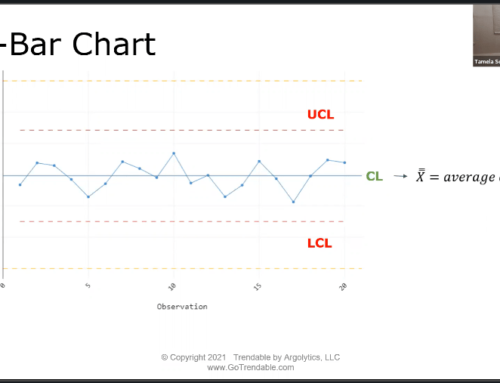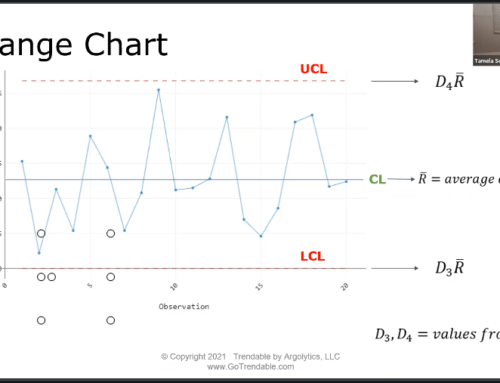
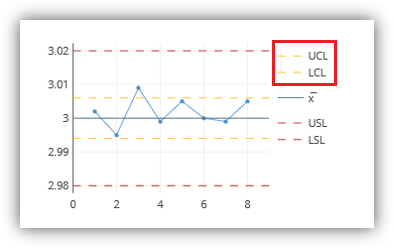
UCL = Upper Control Limit
LCL = Lower Control Limit
Control Limits are calculated based on the amount of variation in the process you are measuring. One measure of variation is standard deviation*. A common method of calculating control limits is the mean +/- three standard deviations. For example, if the average part width measurement is 0.50” and the variation in measurement has a standard deviation of 0.005”, then the control limits are UCL = 0.515” and LCL = 0.485” (based on 3 standard deviations).
A process is considered “in control” when measured data points fall within the three standard deviation control limits. Sigma σ is the Greek symbol used in statistics to represent standard deviation. The term “Six Sigma” refers to the common practice of using +/- 3 standard deviations about the mean to calculate control limits.
Control limits are not the same as specification limits. Specification Limits (or “spec” limits) are set by the customer and typically cannot be exceeded without consequences. For example, if your customer requires the part width to be 0.50” +/- 0.03, then your specification limits are USL = 0.53” and LSL = 0.47”. If the part exceeds these limits, then it must be scrapped or re-worked. The customer will not accept a part outside their tolerances.
*There are several different methods available for calculating standard deviation. Consult a statistician to determine which method is appropriate for your application.