Throughout modern history, industry has evolved and adapted to improve the quality of human life. We are currently in the midst of the next industrial revolution – termed “Industry 4.0”. Like the three industrial revolutions that preceded it, initial skepticism and resistance to change is being replaced with widespread adoption and a commitment to embracing new technologies. As with past industrial revolutions, those that continue to resist evolving their processes risk falling behind their competitors and becoming obsolete.

Before we look at how Industry 4.0 is shaping the future, let’s take a look back at how the three previous revolutions built upon each other and advanced our world. The First Industrial Revolution was humanity’s switch from manual labor to steam power and machines in the mid-1800s. With the introduction of mechanized factory production, the foundation for the modern era was put in place.
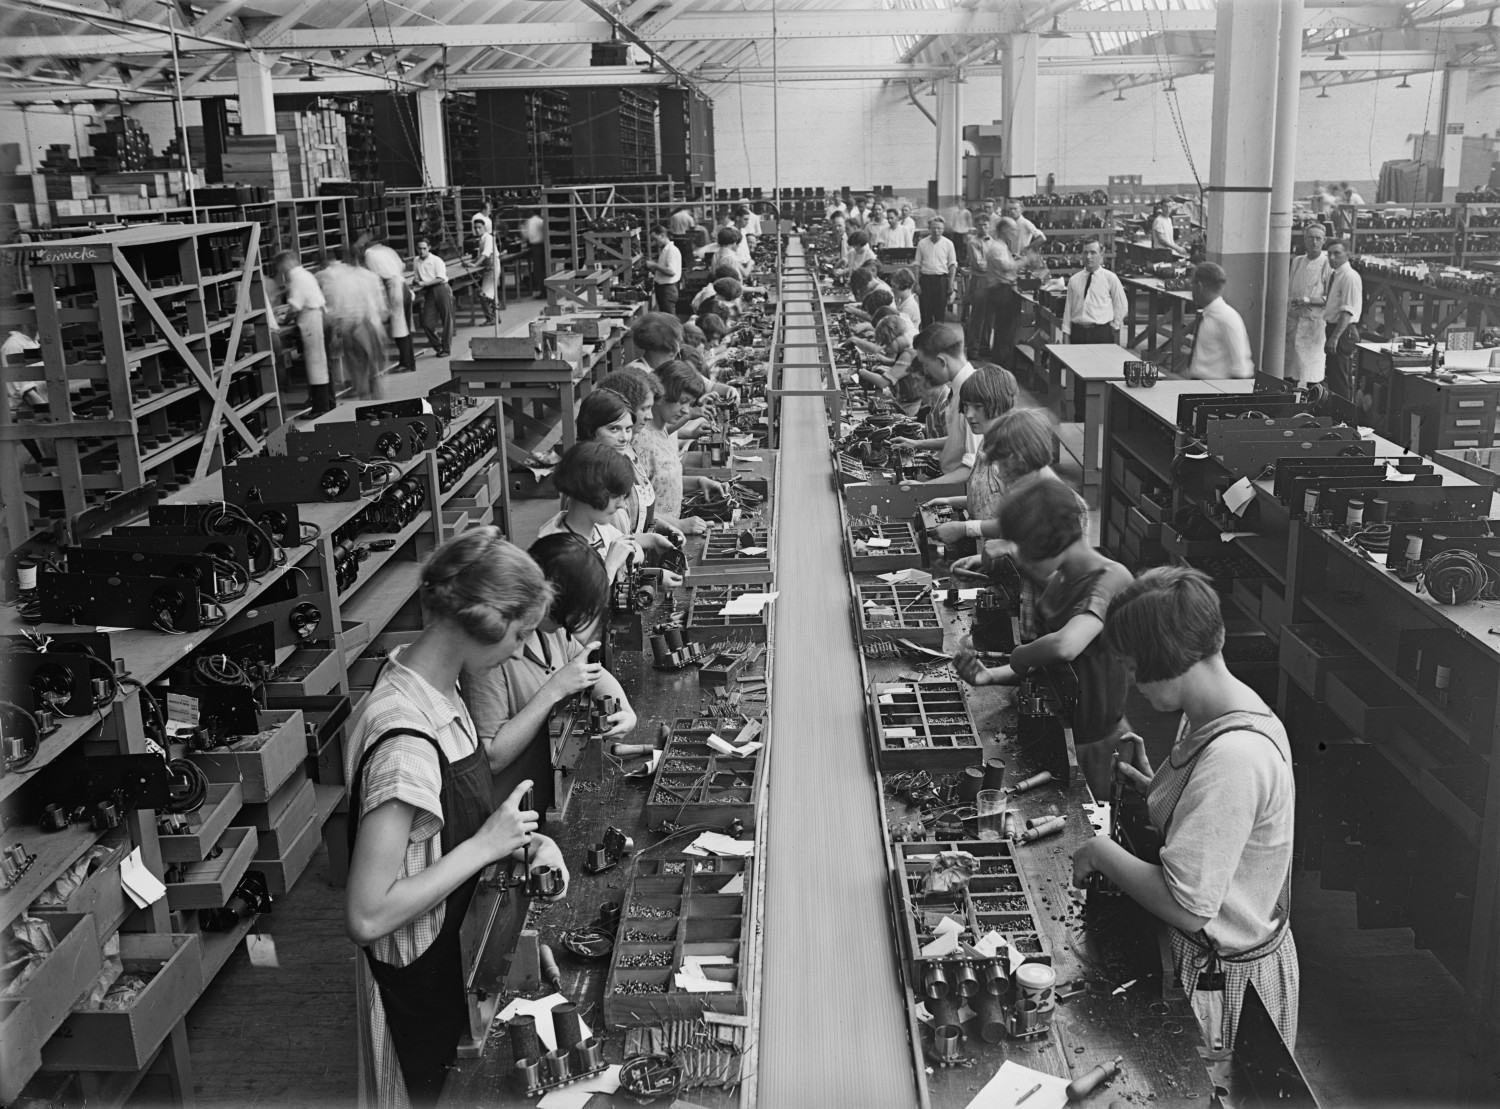
The Second Industrial Revolution started in the late 1800s and continued to the start of World War I in 1914. The Second Industrial Revolution was characterized by electrification of factories and standardized mass production. Of course, the most famous example was Henry Ford’s introduction of the assembly line that set the framework for mass production manufacturing. The second revolution was also a turning point in the numerical assessment of processes – our obsession with “the numbers”.
At the turn of the 20th century, mathematicians were developing the field of statistics to address mass production needs. William Sealy Gosset’s development of the t-test method to make a better Guinness beer in 1912 is an example of a new statistical method that many of us continue to benefit from to this day. Several years later in 1918, Walter Shewhart’s first quality control charts were put into use at Western Electric. The benefits of these early statistical techniques to monitor production were quickly realized. With them brought a greater attention to productivity and product quality, making statistical tools indispensable to manufacturers.
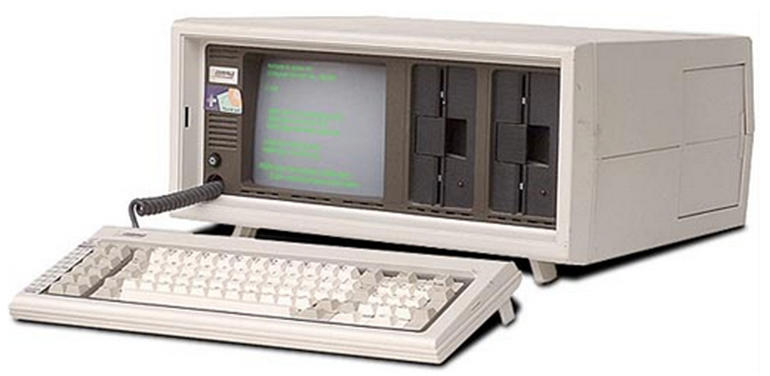
The Third Industrial Revolution started after World War II with the invention of the transistor at Bell Labs. The transistor made modern computers possible. The Third Industrial Revolution is often referred to as the “Digital Revolution”. In the industrial setting, computer technology helped automate production and uncover new sources of efficiencies.
The Third Industrial Revolution extended into the 1980s. At that time, a new method called “Six Sigma” was adopted to improve the quality of mass-produced parts. Six Sigma leveraged data collection and statistical analysis to increase efficiencies on the production line. Companies like Motorola, Allied Signal, and General Electric led the implementation of Six Sigma. Today, manufacturers around the world use Six Sigma methods to improve their products and services.
The Fourth Industrial Revolution is currently underway. The term Industry 4.0 was coined at Hannover Messe (Hanover Fair) in 2011 to refer to the advancements of the Fourth Industrial Revolution. Technologies such as robotics automation, connected devices, sensors, and the internet of things (IOT) feed big data and cloud storage which, in turn, enable sophisticated prediction algorithms and artificial intelligence (AI) methods. Where past revolutions proceeded at a linear pace, the advances of Industry 4.0 are accelerating exponentially.
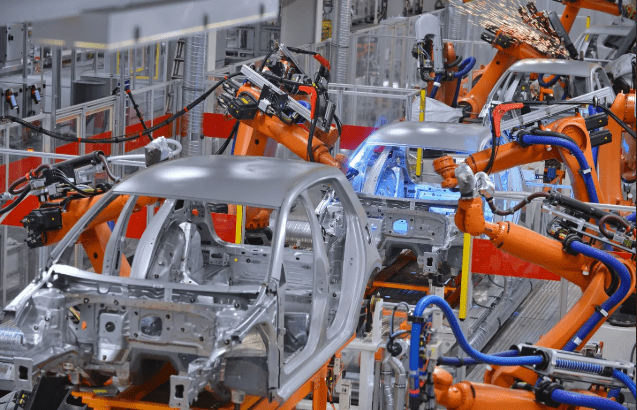
Big industrial powerhouses like General Electric, Seimens, and Rockwell Automation have incorporated these new technologies with great effect. However, a side effect of the rapid pace is that many small manufacturers are struggling to keep up with the latest innovations. Fortunately, start-ups in the technology sector have recognized this gap and are developing advanced Industry 4.0 tools specifically for small manufacturers at affordable prices – Lojic in Erie, PA for shop floor visualization, 80/20 Quality in Lancaster, PA for non-conformance tracking, and TRENDABLE in State College, PA for quality data capture and analysis are just a few examples.