🔮 Data = Revenue
Whether we like to admit it or not, these days there is a direct line from an organization’s ability/willingness to measure processes and the organization’s bottom line. The only way to prove to a prospective client that you are capable of meeting their spec is to “show me the data“. 👀
But how can you justify the cost of implementing data collection systems? This recent article by TDAN.com publisher Bob Seiner digs into six steps:
- Start by recognizing where revenue comes from.
- Identify business factors that improve (or weaken) revenue gains.
- Determine the impact data and information have on these business factors.
- Articulate the connection between data and revenue.
- Direct data actions toward managing data and increasing revenue.
- Measure the changes in revenue resulting from data actions.
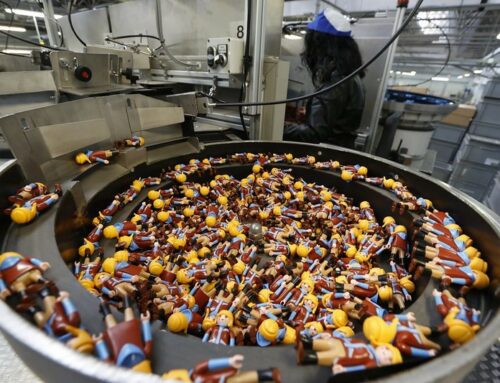
Here at Argolytics we are passionate about helping small manufacturers collect and analyze their production data. A recent affirmation: “we beat out our competitor to win the job because we had the data to back up our promises“.
The most recent release of Trendable for Data Collection helps orgs take the step from paper inspection sheets to true online data capture. We are proud to support small businesses transforming data to dollars! 💸

If you liked this post, sign up to receive our newsletter: